UnscrambleX data · 2025–2026
Where America looks up the daily word puzzle answer
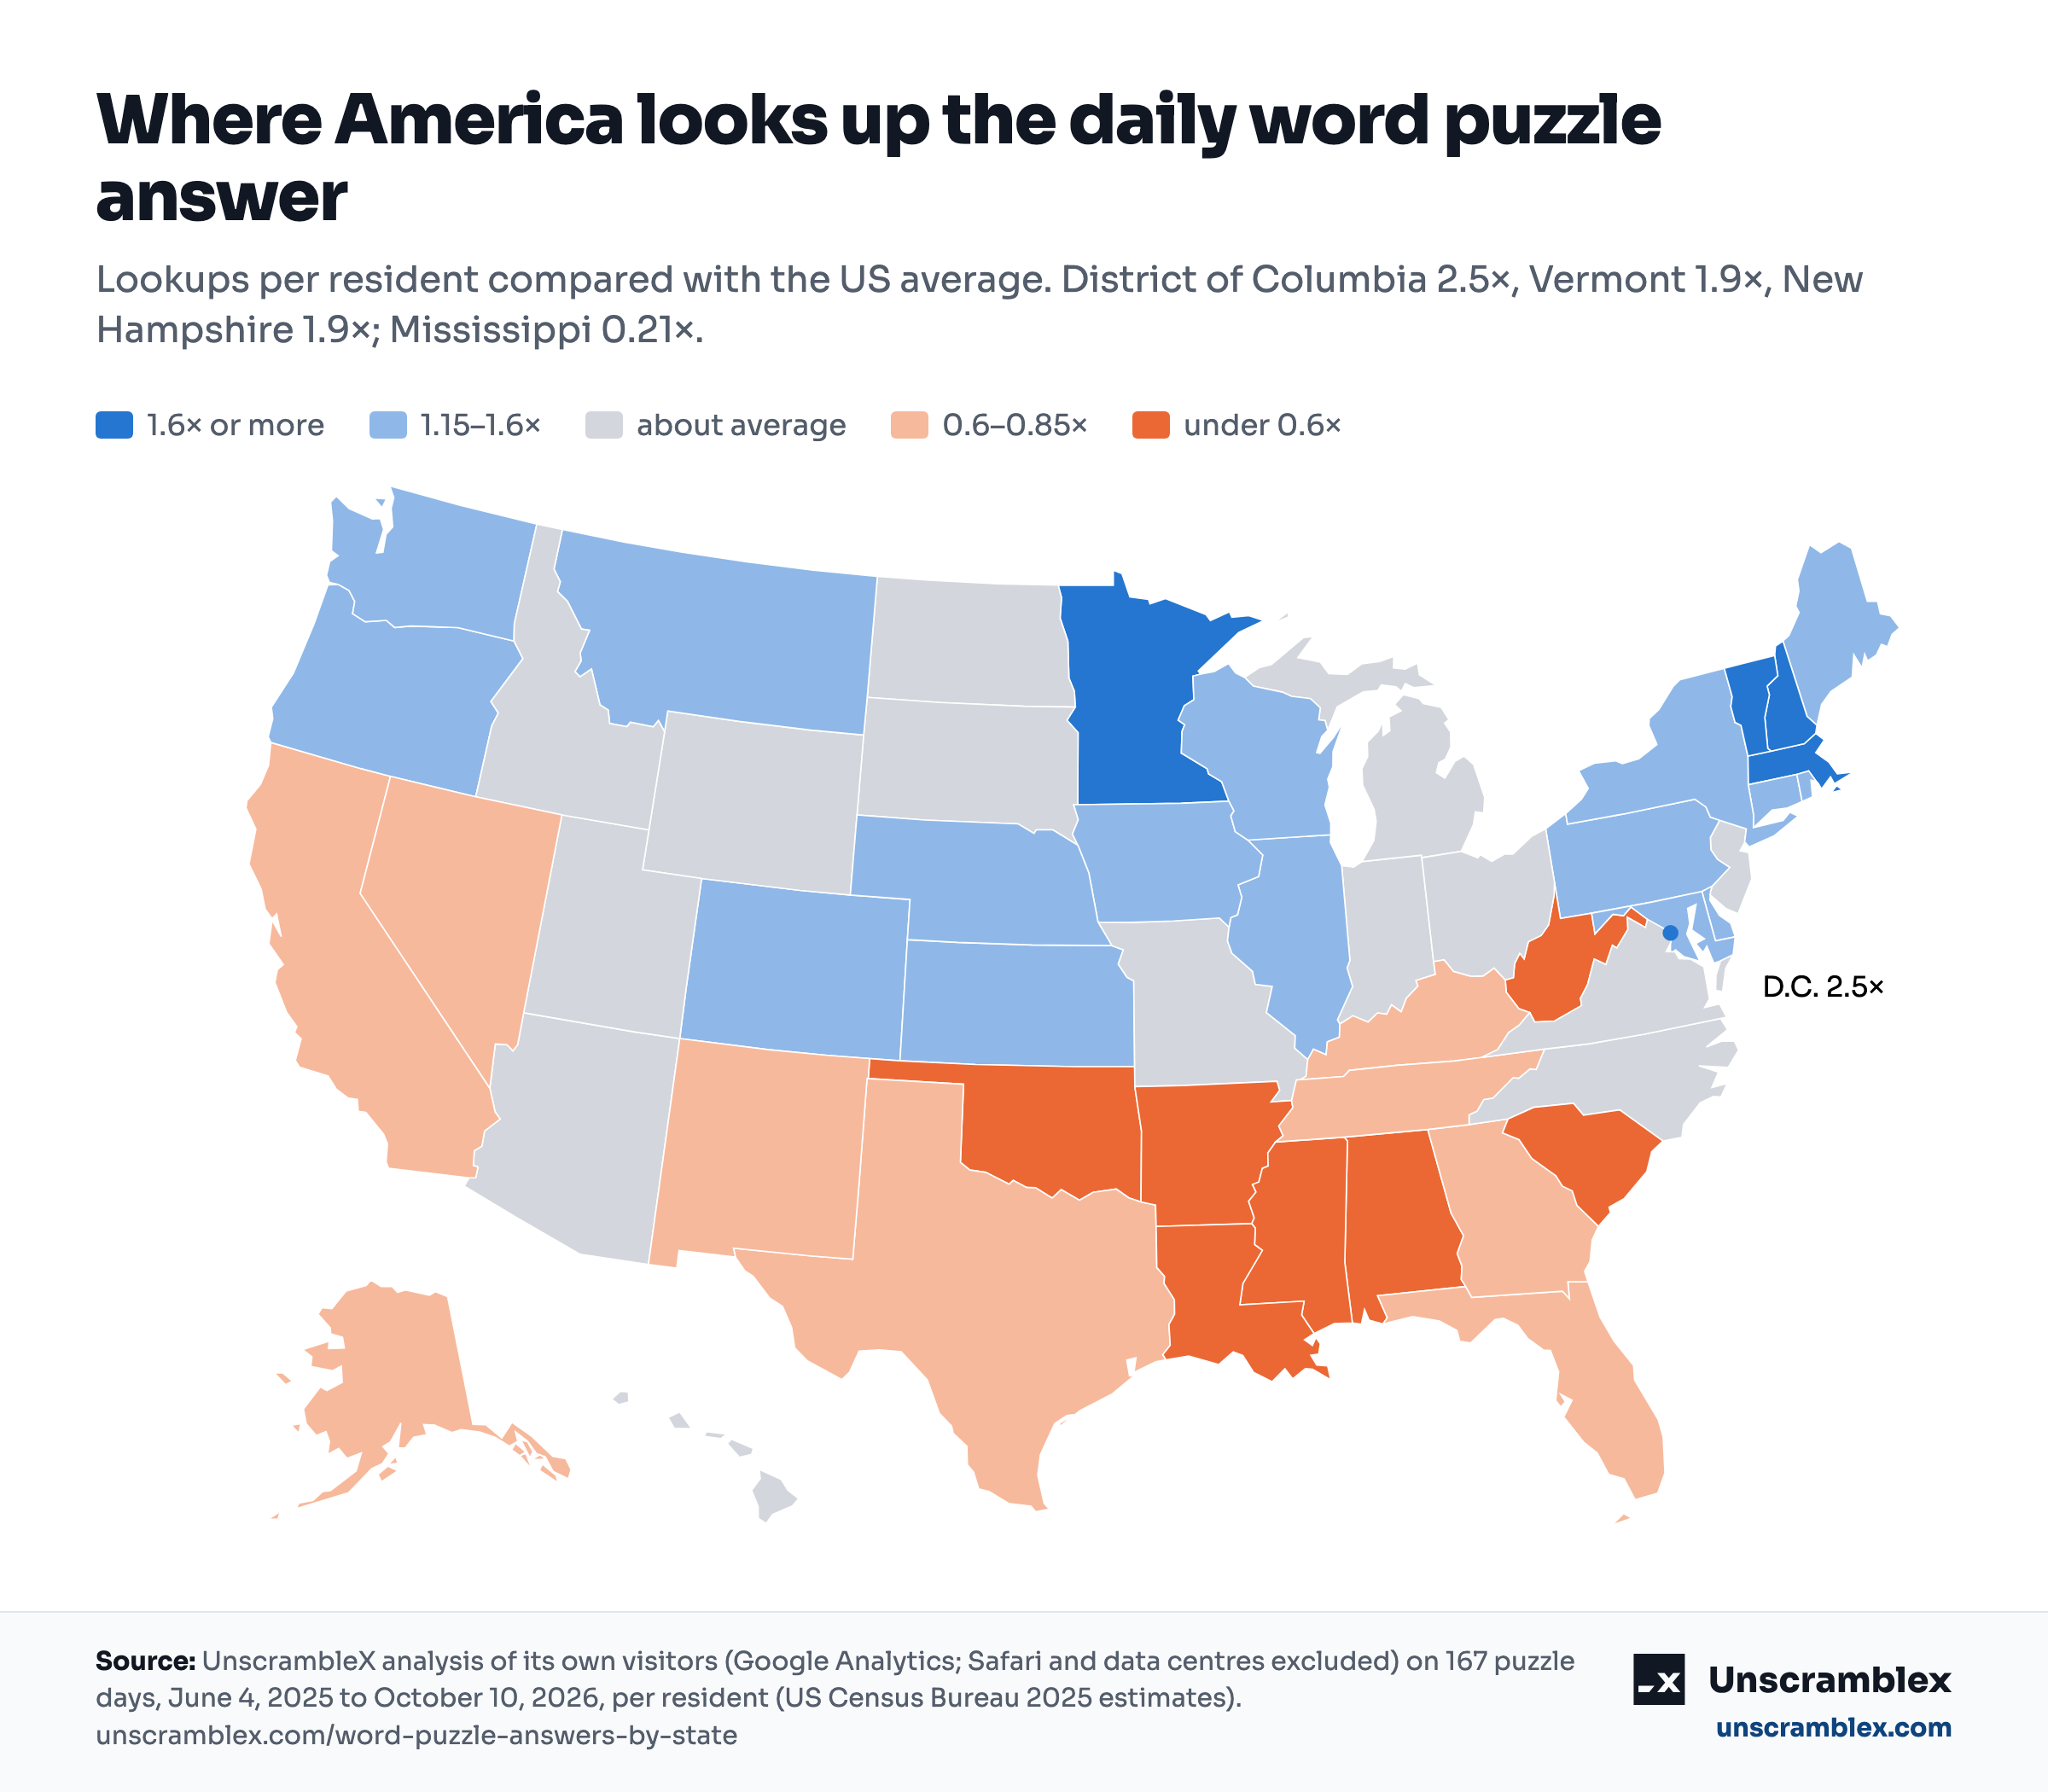
When a daily word puzzle leaves one word unsolved, a lot of people search for the answer. We counted who did, state by state, on the 167 biggest puzzle days from June 2025 to October 2026. Washington, D.C. looked answers up 2.5× as often as the US average, Vermont 1.9× and New Hampshire 1.9×, while Mississippi looked them up 21% as often.
Key findings
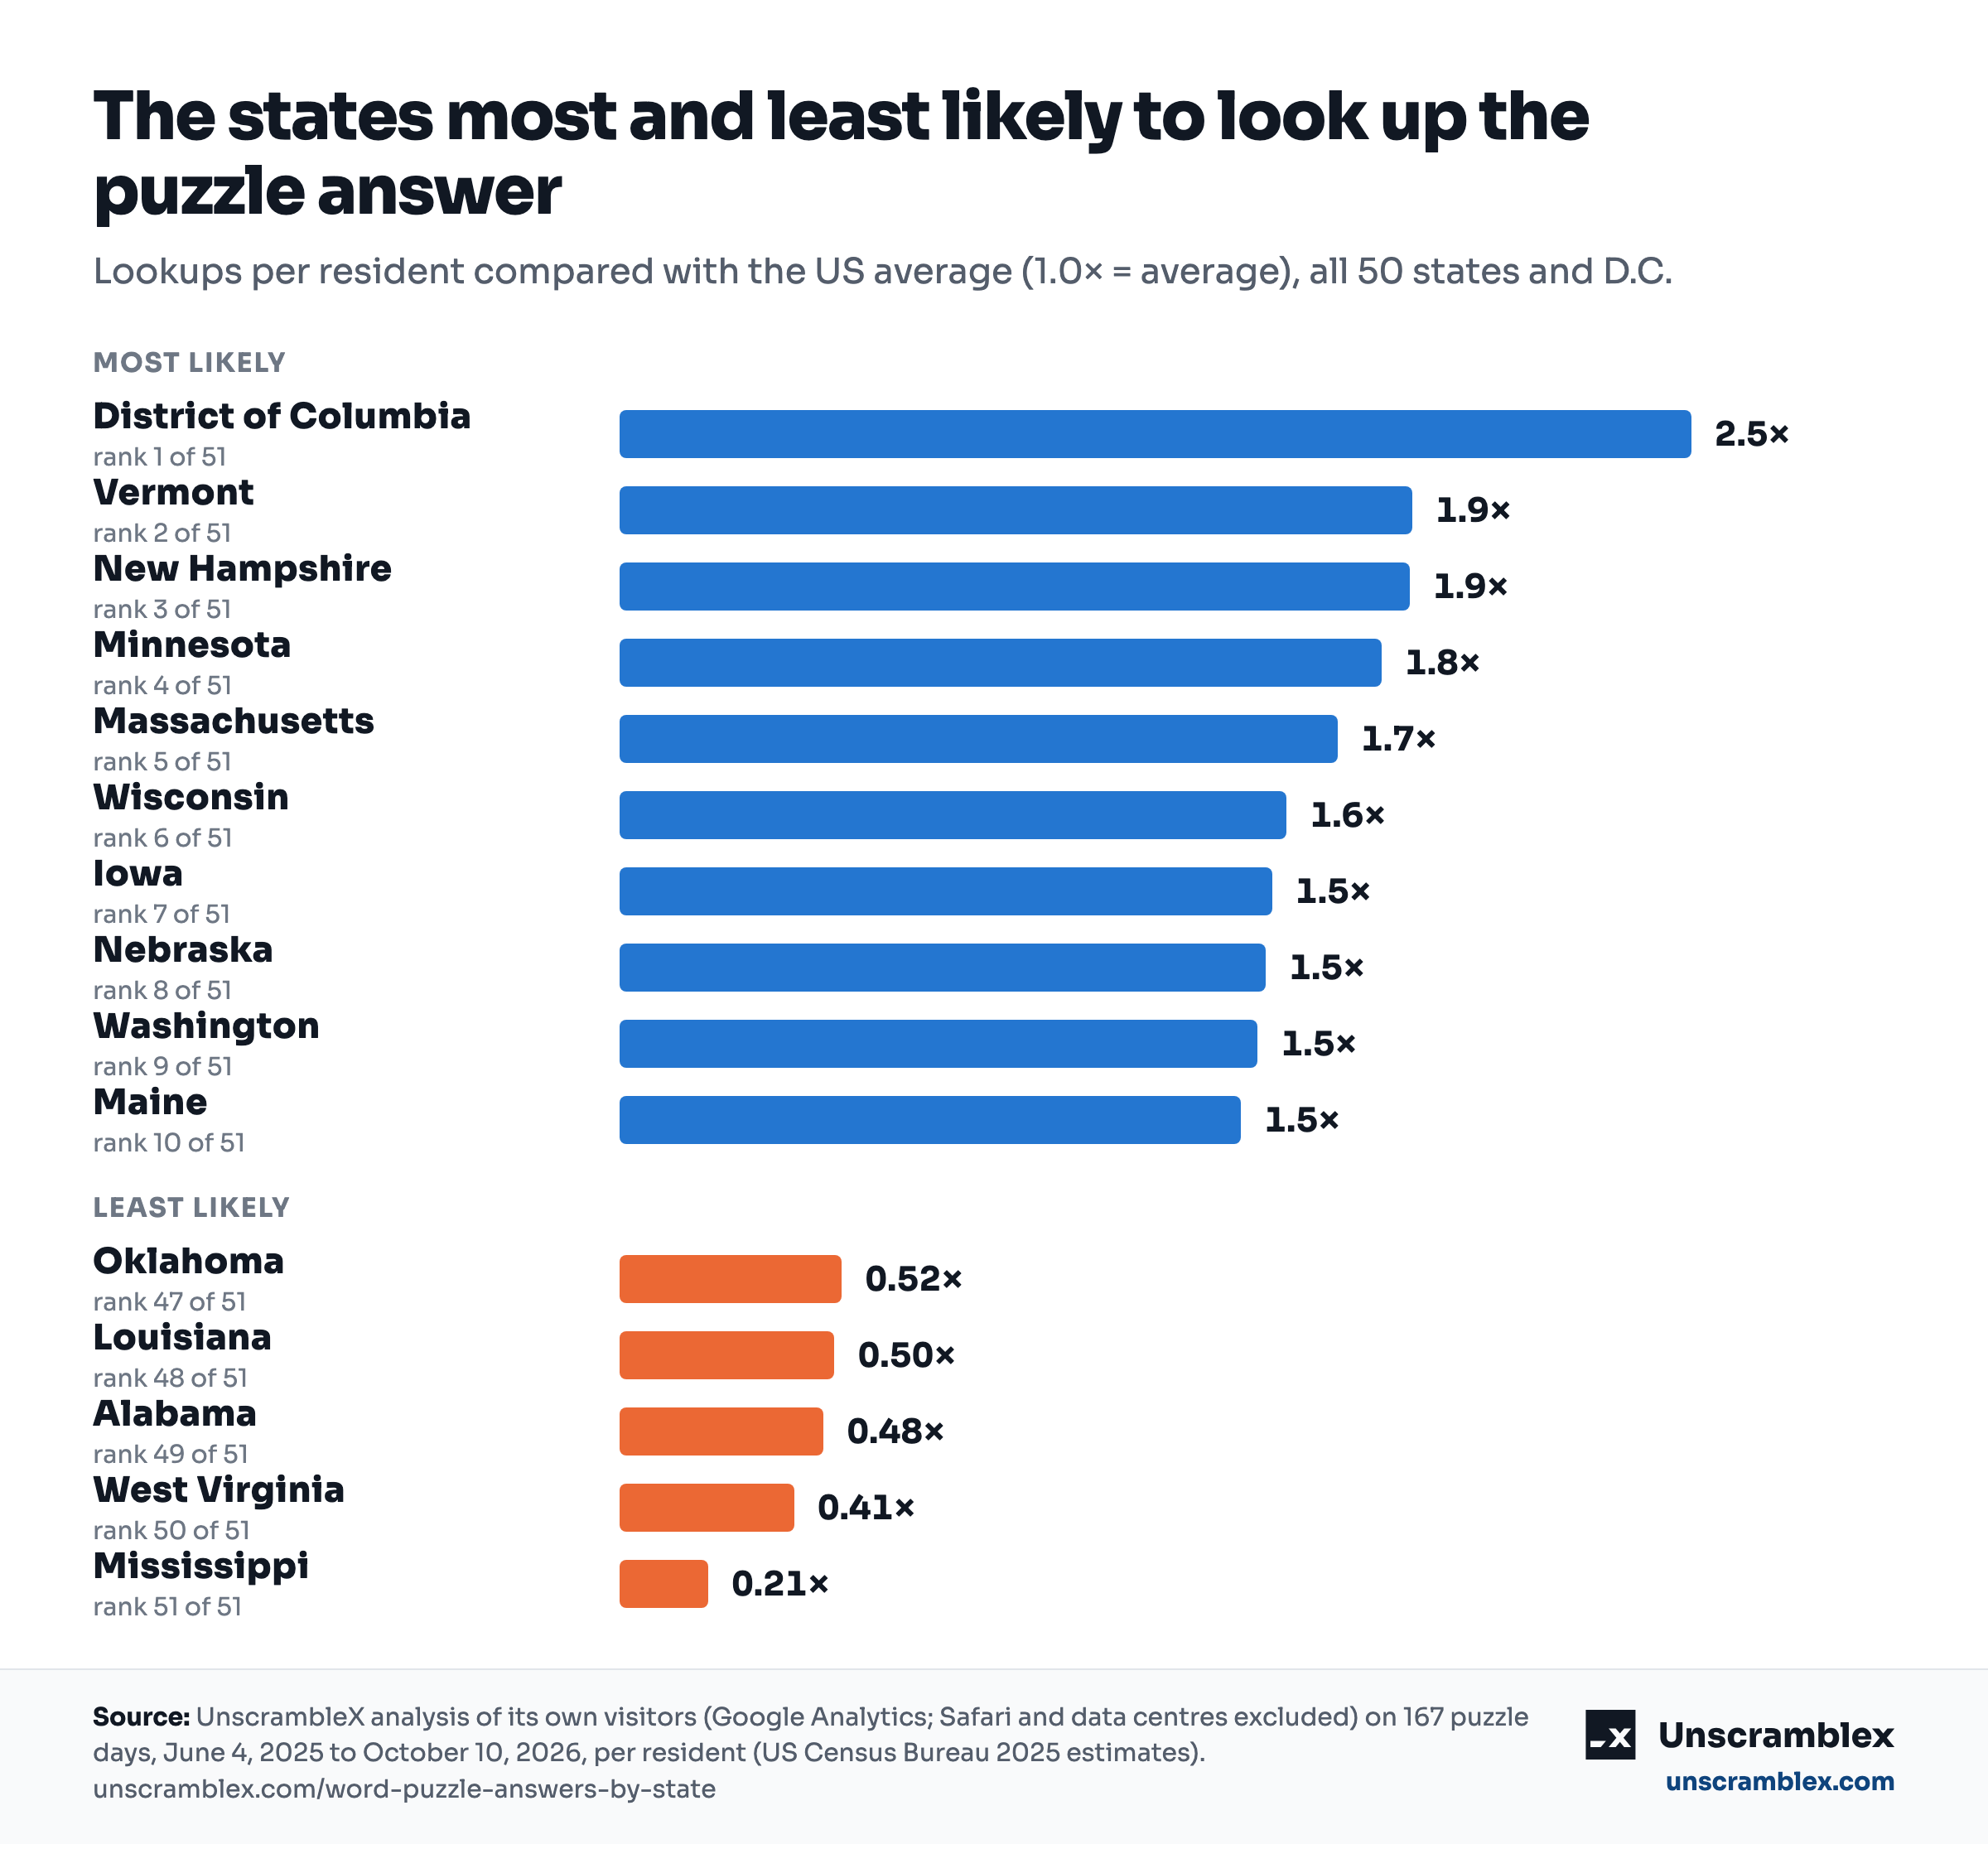
- Washington, D.C. looks the answer up most: 2.5× as often per resident as the US average, ahead of Vermont (1.9×), New Hampshire (1.9×) and Minnesota (1.8×).
- The South looks it up least. Mississippi is lowest at 0.21× the US average, about one lookup for every five in the average state, then West Virginia (0.41×) and Alabama (0.48×). The South as a whole is at 0.72×.
- It is not one hard word. Ranked separately, the 72 puzzles of 2025 and the 95 of 2026 put the states in nearly the same order (rank correlation 0.91).
The map
Most likely to look it up
- District of Columbia 2.5×
- Vermont 1.9×
- New Hampshire 1.9×
- Minnesota 1.8×
- Massachusetts 1.7×
- Wisconsin 1.6×
- Iowa 1.5×
- Nebraska 1.5×
- Washington 1.5×
- Maine 1.5×
Least likely to look it up
- Nevada 0.69×
- Florida 0.67×
- Texas 0.62×
- South Carolina 0.59×
- Arkansas 0.53×
- Oklahoma 0.52×
- Louisiana 0.50×
- Alabama 0.48×
- West Virginia 0.41×
- Mississippi 0.21×
North and South
The pattern runs north to south more than coast to coast. New England and the upper Midwest look answers up most; the Deep South least. The order of the four regions was the same for the 2025 puzzles and the 2026 ones.
Every state, ranked
| Rank | State | vs US average | 2025 | 2026 |
|---|---|---|---|---|
| 1 | District of Columbia | 2.5× | 1 | 1 |
| 2 | Vermont | 1.9× | 4 | 2 |
| 3 | New Hampshire | 1.9× | 2 | 3 |
| 4 | Minnesota | 1.8× | 3 | 4 |
| 5 | Massachusetts | 1.7× | 9 | 5 |
| 6 | Wisconsin | 1.6× | 5 | 7 |
| 7 | Iowa | 1.5× | 6 | 8 |
| 8 | Nebraska | 1.5× | 11 | 6 |
| 9 | Washington | 1.5× | 10 | 9 |
| 10 | Maine | 1.5× | 8 | 12 |
| 11 | Colorado | 1.5× | 16 | 10 |
| 12 | Connecticut | 1.5× | 13 | 11 |
| 13 | Rhode Island | 1.5× | 7 | 13 |
| 14 | Oregon | 1.4× | 14 | 14 |
| 15 | Kansas | 1.4× | 17 | 15 |
| 16 | Illinois | 1.3× | 18 | 16 |
| 17 | New York | 1.3× | 20 | 18 |
| 18 | Pennsylvania | 1.3× | 19 | 19 |
| 19 | Montana | 1.2× | 15 | 23 |
| 20 | Delaware | 1.2× | 35 | 17 |
| 21 | Maryland | 1.2× | 22 | 22 |
| 22 | Ohio | 1.1× | 24 | 24 |
| 23 | Missouri | 1.1× | 28 | 20 |
| 24 | New Jersey | 1.1× | 25 | 25 |
| 25 | Utah | 1.1× | 29 | 21 |
| 26 | Michigan | 1.1× | 26 | 27 |
| 27 | Virginia | 1.1× | 23 | 28 |
| 28 | Wyoming | 1.0× | 33 | 26 |
| 29 | Hawaii | 0.98× | 21 | 33 |
| 30 | North Carolina | 0.96× | 34 | 29 |
| 31 | South Dakota | 0.95× | 12 | 38 |
| 32 | North Dakota | 0.95× | 30 | 31 |
| 33 | Indiana | 0.92× | 31 | 30 |
| 34 | Idaho | 0.90× | 32 | 32 |
| 35 | Arizona | 0.88× | 27 | 36 |
| 36 | California | 0.82× | 38 | 34 |
| 37 | Kentucky | 0.76× | 45 | 35 |
| 38 | Alaska | 0.76× | 36 | 40 |
| 39 | Georgia | 0.76× | 40 | 37 |
| 40 | Tennessee | 0.75× | 39 | 39 |
| 41 | New Mexico | 0.74× | 37 | 42 |
| 42 | Nevada | 0.69× | 44 | 41 |
| 43 | Florida | 0.67× | 41 | 43 |
| 44 | Texas | 0.62× | 46 | 44 |
| 45 | South Carolina | 0.59× | 47 | 45 |
| 46 | Arkansas | 0.53× | 42 | 47 |
| 47 | Oklahoma | 0.52× | 43 | 48 |
| 48 | Louisiana | 0.50× | 48 | 49 |
| 49 | Alabama | 0.48× | 49 | 46 |
| 50 | West Virginia | 0.41× | 50 | 50 |
| 51 | Mississippi | 0.21× | 51 | 51 |
The biggest puzzle days
The answers searched most in the US on a single day, counted as Google search impressions for the word's scrambled letters. Food words keep turning up (POMELO, LYCHEE, ABALONE), as in our puzzle words study.
| # | Word | Day | Impressions |
|---|---|---|---|
| 1 | NEROLI | May 28, 2026 | 67,281 |
| 2 | POMELO | May 18, 2026 | 37,803 |
| 3 | EYEBALL | April 28, 2026 | 13,286 |
| 4 | ORCHARDS | October 26, 2025 | 12,826 |
| 5 | LYCHEE | April 3, 2026 | 12,745 |
| 6 | TENUOUS | November 14, 2025 | 11,263 |
| 7 | ETUDE | June 16, 2025 | 10,058 |
| 8 | AWESOME | January 11, 2026 | 7,583 |
| 9 | NAUGHT | June 21, 2025 | 6,970 |
| 10 | NEGLIGIBLE | March 5, 2026 | 6,957 |
How we measured it
- The puzzle days. From Google Search Console: the 167 days between June 4, 2025 and October 10, 2026 when one answer's scrambled letters drew at least 1,000 search impressions in the US in a day. Impressions count everyone who searched, not only the people who clicked through.
- Who looked. Google Analytics visitors to that word's pages on the day and the day after, by state. Traffic from data centres (Ashburn, Virginia, and similar towns) is removed.
- Without Safari. Safari's iCloud Private Relay routes many iPhone users through other towns, which puts them in the wrong state. We count visitors on other browsers, whose location is reliable. Removing Safari would, if anything, raise the South's numbers, where fewer people use iPhones, and the South still comes last.
- The number. A state's share of all lookups divided by its share of the US population (Census Bureau 2025 estimates). 1.0× is average; 2.0× means twice as many lookups per resident.
- What it means. More lookups can mean more people playing the puzzle, more people getting stuck, or both. It is not a measure of who is smarter.
- Does it hold? Ranked separately, the 72 puzzles of 2025 and the 95 of 2026 put the states in nearly the same order (rank correlation 0.91); the table shows both. D.C. is a city, not a state, and small states have smaller samples, so their ranks move more.
Charts to share
Free to use on your site, in a story or in class, with a link to this page. Each chart is a 1200-pixel PNG with the source on it. Download it, or copy the embed code to show it straight from here.
Use this data
Reporters, teachers and bloggers are welcome to republish any number, table or chart on this page. Please credit UnscrambleX with a link to unscramblex.com.
Questions, a spreadsheet of the figures or a figure for your own state or town: Adrian Talvik, adrian@unscramblex.com.
More from UnscrambleX
- The puzzle words that stumped America
- The Scrabble score of every state, country and NFL team
- Free Scrabble printables: board, tiles, cheat sheets and worksheets
- Word games and spelling help for teachers
- Scrabble clubs near you: every club, where and when it meets
- NWL2023 by the numbers: word counts, letters and records
- Word unscrambler: find every word in your letters